




























NBA Statistics Explained: What Do Points, Rebounds And Assists Reveal?
What do NBA points, rebounds and assists reveal? True shooting, TS%, BPM, net rating and advanced stats explained — how to read box scores like an analyst.

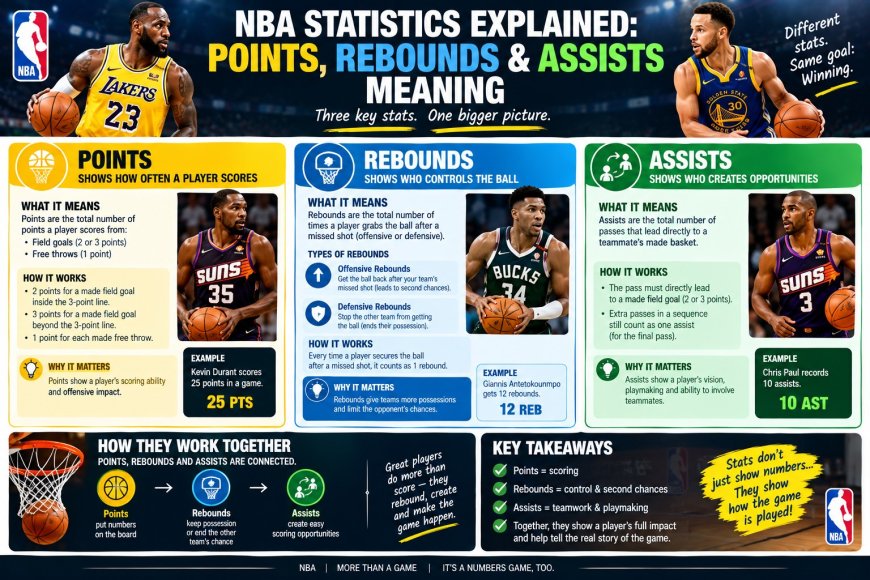
Points, rebounds, and assists — the "triple stat line" printed in every box score — remain the first numbers fans read after an NBA game. They are also among the most debated: do they tell the whole story? Can a player with 30 points have hurt his team? Can a player with 8 points have dominated? The truth is that the traditional big-three statistics reveal a great deal when properly contextualized — but only a fraction of a player's total impact when read alone. Modern NBA analysis layers these foundational numbers with efficiency metrics, advanced impact ratings, and tracking data to build a fuller picture.
1. Points: Scoring Volume and What It Conceals
Points measure the most obvious contribution: putting the ball through the hoop. But points without context mislead badly.
Volume vs. Efficiency
Two players scoring 25 points per game can impact winning very differently:
· True Shooting % (TS%): The workhorse efficiency metric — it incorporates two-pointers, three-pointers, and free throws into one shooting measure (formula: PTS / (2 × (FTA × 0.44 + FGA))). A 25-point scorer at 62% TS is far more valuable than one at 52% TS, because efficiency determines how many possessions a scorer needs to produce his output.
· Effective Field Goal % (eFG%): Adjusts field goal percentage for the added value of threes — ((FGM + 0.5 × 3PM) / FGA). It reveals whether a scorer's "50% shooting" is actually impressive given his shot diet.
Shot Selection and Scoring Breakdown
Points also hide how they were accumulated:
· Rim attempts, corner threes, pull-up threes, and long twos carry different expected values — tracking data maps every attempt.
· Free-throw generation (getting to the line) is a skill that inflates raw scoring while also imposing foul trouble on opponents — a dual value not visible in the point total alone.
· Clutch scoring splits — points in "crunch time" (last five minutes, close games) — separate opportunistic scorers from those who deliver under pressure.
Playmaking Invisible in Point Totals
A player who drives, draws two defenders, and kicks to an open shooter may score zero on the possession yet create the team's best shot. Hockey assists, screen assists, and potential-assist metrics increasingly capture this hidden offensive creation that traditional points ignore.
What points reveal: Scoring burden, usage level, offensive centerpiece status. What they conceal: Efficiency (without rate stats), shot quality, off-ball creation, and defensive value entirely.
2. Rebounds: Possessions Won and the Context Problem
Rebounds end opposing possessions (defensive boards) or create extra chances (offensive boards) — making them literally possession-changing events. But the box-score number requires careful unpacking.
Defensive vs. Offensive Rebounds
· Defensive rebounds secure the gains from a stopped opponent — valuable, but context-heavy: a center collecting rebounds that bounce to him while boxing out deserves credit; a guard snatching boards in traffic may reflect activity more than impact.
· Offensive rebounds are purer gold analytically — they directly create extra possessions and high-value putback opportunities. Teams covet offensive rebounding from wings and bigs alike; second-chance points flow directly from these plays.
The "Rebound Rate" Refinement
Raw totals favor players on slow-paced teams or in rebound-rich roles. Rate stats — rebound percentage (REB%) — estimate the share of available boards a player grabs while on the court, controlling for minutes and pace. Averaging 8 rebounds as a wing in 30 minutes may represent more rebounding skill than 11 as a center in 36.
Team Rebounding and the "Let It Go" Debate
Analytics introduced a nuanced critique: sometimes not crashing the offensive glass (sending four back in transition defense) optimizes team outcomes — giving up a contested offensive rebound chance to prevent fast-break layups at the other end. Modern NBA rebounding strategy balances individual board numbers against transition risk — another example of box stats needing tactical context.
What rebounds reveal: Possession control, interior presence, activity level, role size. What they conceal: Rebounding quality vs. opportunity, defensive positioning value, and whether crashing boards helped or hurt team defense overall.
3. Assists: Playmaking and Its Limits
Assists credit players whose passes directly lead to made field goals — the traditional lifeblood of "pure point guard" evaluation. Like points and rebounds, they illuminate and obscure simultaneously.
What Assists Capture Well
· Passing vision and execution in half-court creation — thread-the-needle feeds, pick-and-roll lobs, and kick-outs to shooters.
· Offensive orchestration — high-assist players usually determine tempo and structure.
· Two-man synergy — assist numbers reveal partnerships (historically, classic point guard–center duos).
What Assists Miss
· Hockey assists — the extra pass before the assist often deserves equal creative credit; tracking now captures it.
· Potential assists — passes that could have been assists if teammates made shots. A point guard generating 15 potential assists whose teammates shoot poorly may be creating brilliantly while showing a modest assist total.
· Gravity and drive-and-kick value — collapsing a defense even without a pass that directly yields a basket.
· Turnover trade-off — assist totals without turnover context overrate risky passers. Assist-to-turnover ratio is the classic corrective; elite playmakers sustain high assists with low giveaways.
Modern Playmaking Metrics
· Assist percentage (AST%) — estimated share of teammate field goals a player assists while on court.
· Touch time and time of possession — tracking data showing who actually controls the ball.
· Points created (ast points + own points) — a broader offensive responsibility measure.
· Passing distance and speed — stylistic fingerprints of playmaking.
What assists reveal: Direct creation, ball dominance, half-court orchestration. What they conceal: Off-ball creation, shot quality of finishes, turnover costs, and the pre-assist pass.
4. The Triple-Double: Milestone or Mirage?
The celebrated triple-double (double figures in points, rebounds, and assists) is a popular shorthand for all-around dominance — and genuinely requires broad contribution. But critics note:
· Rebound accumulation by ball-dominant guards can reflect scheme more than game-changing impact.
· Chasing milestone stats late in decided games is a known phenomenon.
· A quiet 9-9-9 line may accompany more impactful play than a padded 10-10-10.
Modern analysts treat the triple-double as an impressive descriptive milestone — not a causal explanation of winning.
5. The Advanced Layer: Efficiency and Impact Metrics
To contextualize the big three, NBA analysis employs efficiency and impact families:
Efficiency Metrics
· Player Efficiency Rating (PER): A per-minute box-score summary of productivity (Hollinger) — useful for quick comparison, criticized for defensive blindness.
· Box Plus/Minus (BPM) and Value Over Replacement Player (VORP): Estimate a player's per-100-possession impact relative to average/replacement, built from box data.
· Win Shares: Splits total team wins into player contributions (offensive and defensive shares).
On-Off and Net Rating
· Offensive Rating / Defensive Rating (ORTG/DRTG): Points scored/conceded per 100 possessions with a player on court.
· Net Rating (NET): The differential — the closest single-number proxy for two-way impact in lineup context.
· On/Off splits: Team performance with vs. without a player — powerful but confounded by lineup quality and opponent adjustments.
The +/- Family and RAPM
Raw plus/minus tracks score margin while on court; Adjusted Plus/Minus (RAPM) uses large-sample regression against teammate/opponent quality to isolate individual signal — the statistical backbone of many public impact models, including newer machine-learning variants (EPM, LEBRON, DARKO-style metrics) that blend box and tracking inputs. NBA statistics such as points, rebounds, assists, shooting efficiency, and turnovers provide useful information for understanding different aspects of individual and team performance. Stay connected with basketball action at Mahadev Book.
Shot Quality and Impact Tracking
· Contested shot %, shot-quality models (xG-style expected FG): Did the player make tough shots sustainably, or benefit from open looks?
· Defensive matchup difficulty and deflections: Tracking-based defensive proxies弥补ing the box score's historical defensive blindness.
· Screen assists, charges drawn, rotations completed: formerly invisible work, now quantified.
These layers transform the static box score into a dynamic impact profile — points, rebounds, and assists become inputs rather than verdicts.
6. Team-Level Reading: The Box Score as Narrative
For team games, the big stats support structured analysis:
1. Pace context: Totals mean little without possessions played — per-100-possession rates standardize comparison.
2. Shooting splits: FG%, 3P%, FT% — the classic "40-30-90" team-shooting benchmark as a quality barometer.
3. Turnover margin and assist ratio: Ball security and ball movement — two of the most stable indicators of sustainable offense.
4. Rebounding margin and second-chance points: Interior control translated into extra possessions.
5. Points in the paint, fast-break points, bench points: Style-of-play signatures that explain how the final score was built.
A team winning with fewer assists and heavy isolation scoring tells a different strategic story than one winning through ball movement — even with identical point totals.
7. Common Misreadings of the Big Three
· "He scored 30, he was the best player." Not if efficiency cratered, turnovers spiked, and defensive impact was negative.
· "She only had 6 assists, she's not facilitating." Check potential assists, points created, and offensive rating — teammates may simply have missed.
· "He's a stat-stuffer — rebounds don't matter for a guard." Guard rebounding often triggers transition; value depends on what happens next, not the box alone.
· "High assists = great offense." If paired with high turnovers and low team efficiency, the creation came at excessive cost.
Each misreading shares one root: treating descriptive counts as evaluative judgments without context layers.
8. Putting It All Together: A Framework for Reading an NBA Box Score
A practical sequence for fans and analysts:
6. Start with the triple stat line — points, rebounds, assists — for the narrative skeleton.
7. Add efficiency — TS%, eFG%, turnovers — to assess scoring and possession care.
8. Check the advanced impact row — +/- or net rating in context, ideally with lineup awareness.
9. Inspect shot distribution and playmaking depth — threes vs. middies, potential assists, screen assists where available.
10. Adjust for pace and opponent — per-100 numbers, strength of competition, game state (blowouts distort everything).
11. Ask the causal question: Did this stat line cause winning — or merely accompany it?
This discipline — descriptive stats first, evaluative context second — is exactly how front offices, media analysts, and serious fans navigate the modern NBA's data abundance.
9. Historical Perspective: How Box Stats Evolved
The NBA's statistical culture has transformed across decades. In the league's early years, box scores were minimal — points, fouls, and perhaps field goals — and debate relied on gut feel. The 1980s brought per-game averaging into mainstream discourse; the 2000s analytics revolution (pioneered by sites like 82games, Basketball-Reference, and front-office analysts) introduced pace-adjusted ratings, plus-minus studies, and shot-chart economics. Today's tracking era — Sportradar and Second Spectrum optical systems — generates millions of data points per game: player accelerations, screen angles, contest heights, and passing lanes. Each layer did not replace the previous one; it contextualised it. Points, rebounds, and assists remain the entry point printed on scoreboards worldwide, while advanced metrics orbit around them as interpretive rings. Understanding this evolution matters for literacy: the "old-school vs new-school" debate is largely a false dichotomy — great analysts have always cared about the same underlying questions (efficiency, impact, contribution), only the measurement tools have sharpened. Fans fluent in both vocabularies can appreciate a 1970s triple-double and a 2020s EPM rating as answers to the same timeless question: how much did this player help his team win?